Figures, Infrastructures
An Atlas of roads and railways
Bieke Cattoor, Bruno De Meulder
Figures Infrastructures is a unique exploration into the language of cartography. The book demonstrates the capacity of maps to constructively re-imagine the everyday urbanised territory.
Case Study
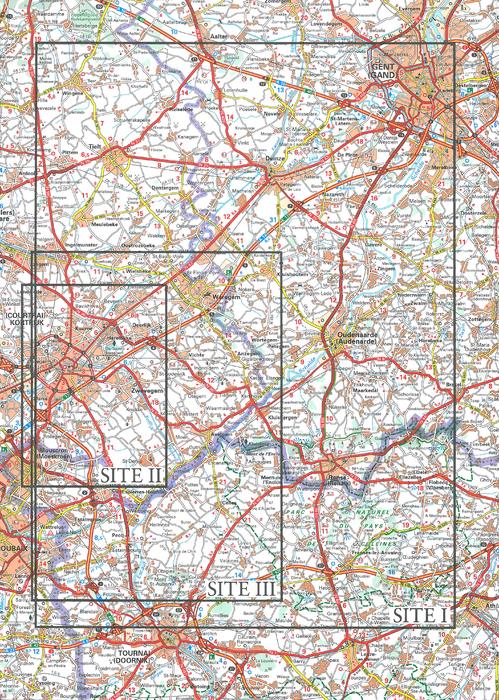
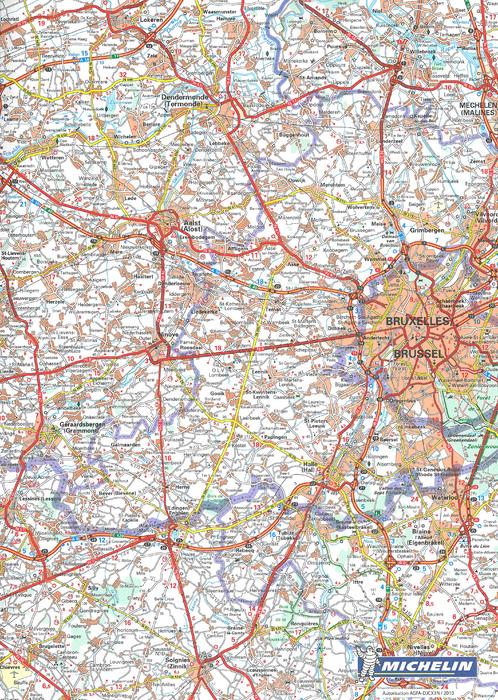
The case study of Figures infrastructures is the landscape of infrastructures portrayed in section E-18 to H-16 of the Michelin roadmap n.533 "regional Benelux". Crammed with lines of all sorts, this section of the Michelin roadmap points the way in the Leie-Schelde interfluvium. The cut-out roughly follows the contour of a square stretched around the cities of Ghent, Kortrijk (Courtrai) and Doornik (Tournai).
Method
The content of a single map is recomposed into the format of a book and becomes an atlas. The lines on the map are a given. As they are more or less straightforward representations of the existing transport infrastructures, they remain unaltered. They are however subject to a rearrangement: the given lines are forced into a new medium. By transferring the lines into the format of the atlas, the reconception of the infrastructural networks takes on a renewade shape. The aura of precision and comprehensiveness emanating from the familiar Michelin roadmap, which gives confidence to the traveler, is abandoned. In the space of the book, stories are densely stacked, Cartesian projection moves over for multiple composition. Vice versa, the format of the atlas is expanded to assimilate and amplify the reconception of the infrastructural networks.
Table of contents
The structure of the atlas is topological, unraveling the spatial dynamics between the infrastructural networks - roads and railroads - as they develop historically over time into complex interrelated systems.
An often cited example of a topological map is Beck’s design of the London Underground Map. Shifting the map’s emphasis from topographical correctness to structural (relational) clarity, Beck’s redesign conveys an almost diagrarnmatical understanding of the subway as a system of interrelated lines and stops. Figures Infrastructures uses topology not in the design of its single maps, but in the way the infrastructural lines are arranged across its pages or it’s page-cutting. Within this topological structure, three cartographic "figures" operate between the infrastructures and the maps, each constructing a distinct narrative.
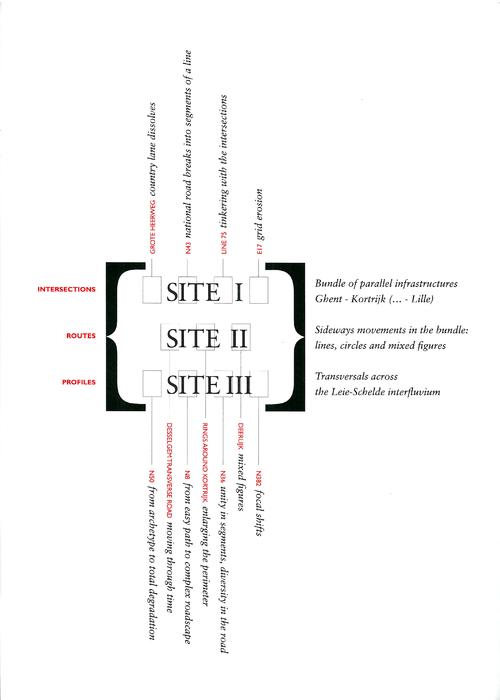
The atlas is setup in three parts, three SITES I, SITE II and SITE III. These three SITES interact with each other, in a way that mirrors the perceived interactions between the infrastructural lines.
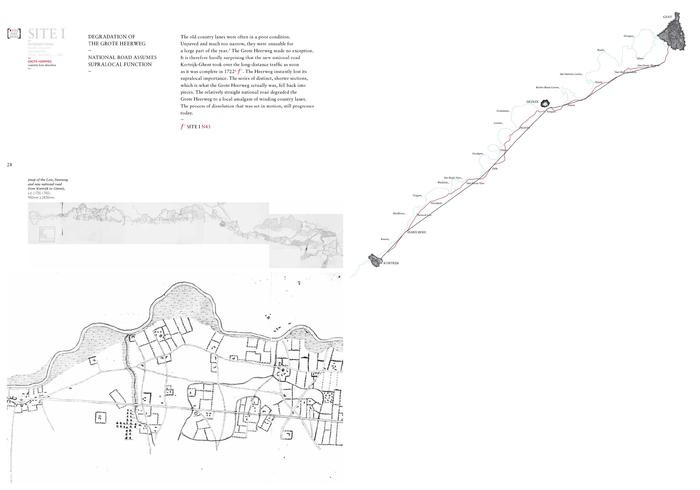
• SITE I maps the direct connections between Ghent and Kortrijk: heerweg (military country road), national road, railway and motorway. These four parallel lines are juxtaposed in the four chapters of SITE I. Compiled in a SITE, they picture the bundle of parallel infrastructures that operate between the two cities.
• SITE III deals with a second configuration of parallel infrastructures, at right angles to this bundle. They are the paved roads that distribute the traffic to and from the Ghent-Kortrijk axes across the territory.
• SITE II, positioned in between SITE I and SITE III, where the parallel bundle and the transversals meet, displays the smaller infrastructural patterns that linlk both.
------------------------------------------------------------------------------------------------------------
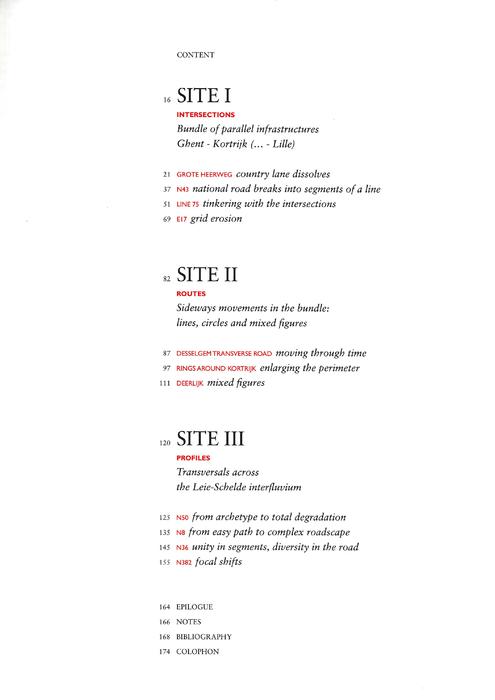
CONTENTS
SITE I Intersections
Bundle of parallel infrastructures Ghent - Kortrijk (... - Lille)
• GROTE HEERWEG Country lane dissolve
• N43 National road breaks into segments of a line
• LINE 75 tinkering with the intersections
• E17 grid erosion
SITE II Routes
Sideways movements in the bundle: lines, circles and mixed figures
• DESSELGEM TRANSVERSE ROAD moving through time
• RINGS AROUND KORTRIJK enlarging the perimeter
• DEERLIJK mixed figures
SITE III Profiles
Transversals across the Leie-Schelde interfluvium
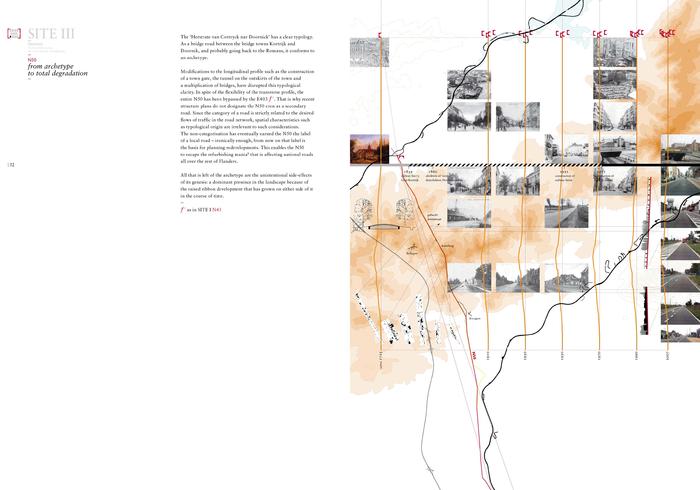
• N50 from archetype to total degradation
• N8 from easy path to complex roadscape
• N26 unity in segments, diversity in the road
• N382 focal shifts
Epilogue
Notes
Bibliography
Colophon
ABOUT THE AUTHORS:
Bieke Cattoor is an urbanist and researcher at the Catholic University of Leuven, Belgium. She is preparing a dissertation on the potential of cartography to inform and to shape territorial urbanisms.
Bruno De Meulder is Professor of Urbanism at the University of Technology Eindhoven, the Netherlands, and the Catholic University of Leuven, Belgium.
------------------------------------------------------------------------------------------------------------

Reviews:
Related articles:
-
On mobility 2 Riconcettualizzazioni della mobilità nella città diffusa
-
Book review Figures, Infrastructures. An Atlas of roads and railways, B. Cattoor, B. De Meulder

-
Infrastructural Urbanism
-
Megastructure Schiphol
Design in Spectacular Simplicity -
Quando l'autostrada non basta
Infrastrutture, paesaggio e urbanistica nel territorio Pedemontano Lombardo


Planum
The Journal of Urbanism
ISSN 1723-0993
owned by
Istituto Nazionale di Urbanistica
published by
Planum Association